Introduction
When you’re writing unit tests, making sure your code is fully tested is super important. Jest, which is one of the most popular JavaScript testing tools, comes with a built-in coverage report to show how well your code is being tested. It’s a handy tool for seeing what’s covered and what still needs testing, but it can be a little tricky to figure out at first.
In this post, we’ll break down everything you need to know about the Jest coverage report. We’ll explain the different types of coverage, what the colours mean, and how you can use the report to improve your tests. Plus, we’ll dive into what those “1x” and “2x” labels mean and go through some practical examples with code snippets to help make everything clearer.
Assumptions
Before we jump into understanding the Jest coverage report, let’s make sure we’re on the same page:
- Jest Setup: You should already have Jest installed and set up in your project. Make sure everything is running smoothly!
- Familiarity with Writing Tests: You should have a basic grasp of how to write tests using Jest. This means you know about the test structure and how to use the
describe,test, andexpectfunctions.
If you need help setting up Jest or writing your first test cases, you can refer to the official Jest documentation.
What is the Jest Coverage Report?
Wondering if you have too few test cases or if you’re just right? The Jest coverage report can help! It shows you how much of your code is actually covered by the tests you’ve written by generating an HTML file. When you run your tests with the --coverage flag, Jest takes a look at how well your code is being tested and creates a coverage report.
This report is saved in the coverage/lcov-report folder and gives you a summary along with a detailed breakdown of your code coverage. Plus, it includes easy-to-read visual indicators to help you see what’s covered and what needs more attention.
Types of Coverage in Jest
In the Jest coverage report, you’ll come across four key types of coverage:
- Statements Coverage: This shows the percentage of executable statements in your code that have been tested. For example, if a function has 10 statements and 8 of them are tested, your statements coverage would be 80%.
- Branches Coverage: This measures the percentage of code branches, like those in
if,else, orswitchstatements, that have been tested. If anif-elsestatement has 4 branches and 3 are tested, you’ll have 75% branch coverage. - Functions Coverage: This tracks the percentage of functions or methods that have been called in your tests. So, if you have 5 functions in your code and 4 of them are tested, your functions coverage would be 80%.
- Lines Coverage: This tells you the percentage of lines in your code that were executed during testing. If your code has 100 lines and 85 of those are covered by tests, your line coverage would be 85%.
These coverage metrics help you understand how thoroughly your code is being tested!
Understanding the 1x, 2x Annotations
In the coverage report, you might see some lines or branches marked with labels like 1x, 2x, and so on. These numbers show how many times a particular line of code or branch was executed during your tests. Here’s what they mean:
- 1x: This means the line or branch was executed once during the test run.
- 2x: This indicates that the line or branch was executed twice, which could happen if a loop or conditional block was run multiple times.
Why It Matters: These annotations help developers spot areas of the code that are run often. If certain lines or branches are executed frequently, it might be a good idea to conduct more thorough testing to cover any edge cases that could cause issues.
Colour Codes in Jest Coverage Report
Jest uses different colour codes to help you visualise coverage in your report:
- Yellow: This colour indicates partial coverage. It means that some parts of a conditional branch are tested, but not all paths have been covered.
Example: In an if-else block, if only the “if” branch is tested and the “else” branch is not, it will be marked yellow. - Pink: This colour marks lines or branches that have no coverage at all.
Example: If a function or branch hasn’t been executed by any test cases, it will show up as pink.
Increasing Coverage by Reading the Jest Report
Boosting your test coverage starts with figuring out where your tests are falling short. Here’s how you can use the Jest report to improve coverage:
- Analyse the Uncovered Areas: Check for the pink or yellow sections in the report. Pink means the code isn’t covered at all, and yellow shows it’s only partially covered.
- Write Tests for Missing Branches: If an
if-elsestatement has an untested branch, write a test specifically for the missing part. This will help you cover those gaps. - Test Edge Cases: Pay attention to lines or branches marked with 1x or 2x. These areas might benefit from extra tests that cover unusual or edge cases that could break your code.
- Refactor Code for Testability: Sometimes, your code might be tricky to test. If that’s the case, consider refactoring it. Breaking complex functions into smaller, simpler ones can make testing easier and more effective.
Practical Example with Code Snippet
Let’s walk through a simple example using a calculator function and see how we can write tests to cover it fully:
// src/Calculator.js

import React, { useState } from "react";

const Calculator = () => {
  const [result, setResult] = useState(0);

  const add = (a, b) => a + b;
  const subtract = (a, b) => a - b;
  const multiply = (a, b) => a * b;
  const divide = (a, b) => (b === 0 ? "Cannot divide by 0" : a / b);

  const handleCalculate = (operation, a, b) => {
    let res;
    switch (operation) {
      case "add":
        res = add(a, b);
        break;
      case "subtract":
        res = subtract(a, b);
        break;
      case "multiply":
        res = multiply(a, b);
        break;
      case "divide":
        res = divide(a, b);
        break;
      default:
        res = 0;
    }
    setResult(res);
  };

 const num1 = 4;
 const num2 = 2;
  return (
    <div>
      <h1>Calculator</h1>
   <h5>Num 1: {num1} <br/> Num 2: {num2}</h5>
      <p>Result: {result}</p>
      <button onClick={() => handleCalculate("add", num1, num2)}>Add</button>
      <button onClick={() => handleCalculate("subtract", num1, num2)}>
        Subtract
      </button>
      <button onClick={() => handleCalculate("multiply", num1, num2)}>
        Multiply
      </button>
      <button onClick={() => handleCalculate("divide", num1, num2)}>Divide</button>
    </div>
  );
};

export default Calculator;
Here’s the test case for this function:
// src/App.test.js

describe("Calculator Component", () => {
  test("adds two numbers", () => {
    render(<App />);
    fireEvent.click(screen.getByText(/Add/i));
    expect(screen.getByText(/Result: 6/i)).toBeInTheDocument();
  });

  test("subtracts two numbers", () => {
    render(<App />);
    fireEvent.click(screen.getByText(/Subtract/i));
    expect(screen.getByText(/Result: 2/i)).toBeInTheDocument();
  });

    test("multiplies two numbers", () => {
    render(<App />);
    fireEvent.click(screen.getByText(/Multiply/i));
    expect(screen.getByText(/Result: 8/i)).toBeInTheDocument();
  });
});
Test Cases and Coverage Report Image
After running the tests with npm test, you’ll get a coverage report that looks something like this:
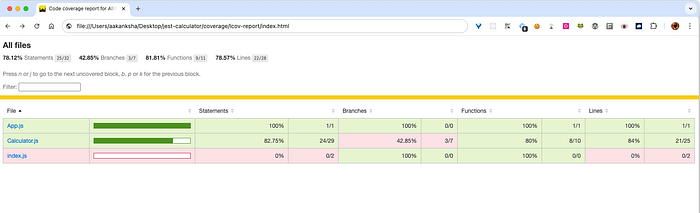
Consider Calculator.js from above —
- Statement Coverage = 82.75%
- Branch Coverage = 42.85%
- Function Coverage = 80%
- Line Coverage = 84%
Now, if you want to see how to improve coverage for each part of your code, open the lcov-report in your coverage folder. From there, check out Calculator.js—it’ll look something like this:
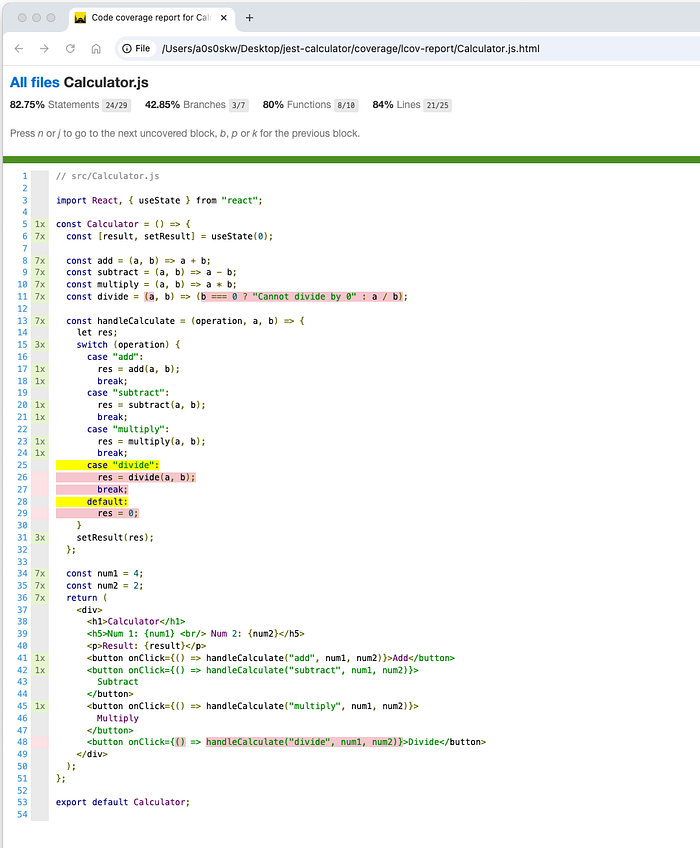
Take a look at line number 11 and 48. We completely missed writing a test case for it, and it’s a function. So, we can easily bump up our function coverage by writing a test case for the divide function.
// src/calculator.test.js
describe("Calculator Component", () => {
// Add the bottom
test("divides two numbers", () => {
render(<App />);
fireEvent.click(screen.getByText(/Divide/i));
expect(screen.getByText(/Result: 2/i)).toBeInTheDocument();
});
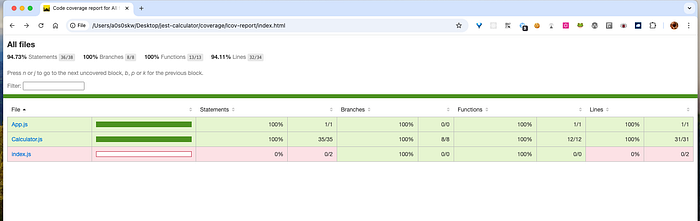
});After adding the test case mentioned earlier, you’ll notice an increase in your coverage, and it will now look like this:
- Statement Coverage = 96.55%
- Branch Coverage = 71.42%
- Function Coverage = 100%
- Line Coverage = 96%
Check the generated report again. We’re still missing branch coverage at line 11 for the case where b = 0. Let’s add a test case to cover that scenario.
// src/Calculator.js

// Add divide by 0 button on UI
const num3 = 0;
<button onClick={() => handleCalculate("divide by 0", num1, num3)}>Divide by 0</button>
// src/Calculator.js
// Add divide by 0 in switch case
case "divide by 0":
res = divide(a, b);
break;// src/App.test.js
// Testcase for Divide by 0
test("handles division by zero", () => {
render(<App />);
fireEvent.click(screen.getByText(/Divide by 0/i)); // assuming a test for divide by 0 is required later
expect(screen.getByText(/Cannot divide by 0/i)).toBeInTheDocument();
});After adding the above test case, your coverage will now look like this:
- Statement Coverage = 96.96%
- Branch Coverage = 87.5%
- Function Coverage = 100%
- Line Coverage = 96.55%
Now, let’s tackle the scenario where the function hits the default case. This happens when an invalid operation is passed that doesn’t match any of the existing conditions (add, subtract, multiply, or divide). Here's how we can add a test case for that:
test("handles default", () => {
  render(<App />);
  fireEvent.click(screen.getByText(/modulus/i));
  expect(screen.getByText(/Result: 0/i)).toBeInTheDocument();
});
Explanation:
- This test checks the default case in the
calculatefunction. - It ensures that when an unrecognised operation is provided (in this case,
modulus), the function returns0, which improves the branch coverage further.
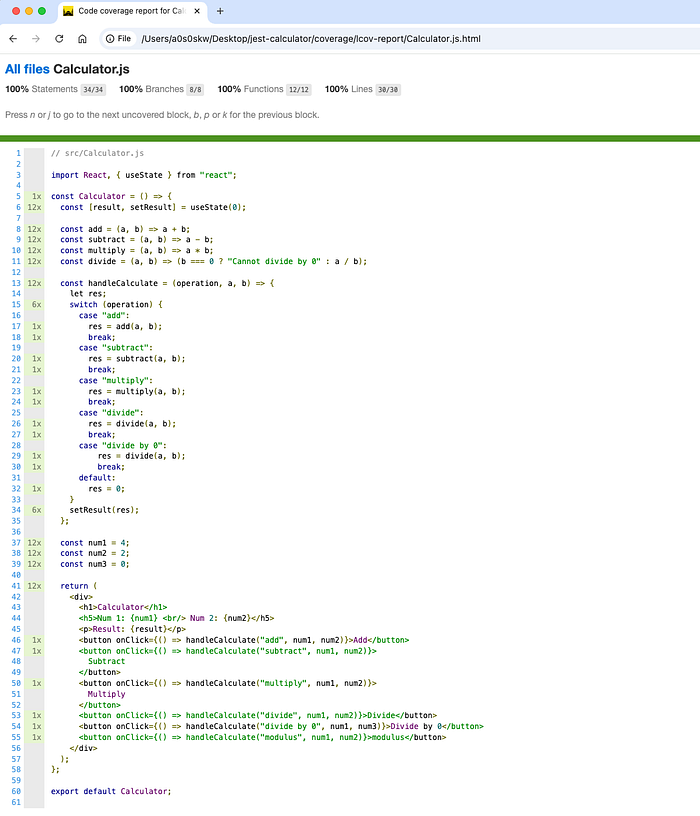
By adding this test case, you’ll ensure that the function behaves as expected, even when it encounters unexpected input.
After this, you’ll see that all the coverage has reached 100% for Calculator.js. There will be no more yellow or pink colours indicating missing or partial coverage, as all lines, statements, functions and branches are fully covered.
Conclusion
In this guide, we’ve walked through everything you need to know about the Jest coverage report. We explored the different types of coverage — statements, branches, functions, and lines — and understood what the color codes mean. We also discussed how to read the report and use it to improve your test coverage by identifying gaps and writing better test cases.
By now, you should have a solid grasp of how to navigate and utilize the Jest coverage report to make sure your code is fully tested and reliable. Keep using these tools and strategies to ensure that your projects are always in great shape!
#Jest #react #reactTesting #testCoverage